 Web Server Statistics for JUSTHEARSENAROUND.COM Web Server Statistics for JUSTHEARSENAROUND.COM
(Go To: Top: General Summary: Daily Summary: Hourly Summary: Domain Report: Organization Report: Operating System Report: Status Code Report: File Size Report: File Type Report: Directory Report: Request Report)
This report contains overall statistics.
Successful requests: 4,499
Average successful requests per day: 4,501
Successful requests for pages: 4,047
Average successful requests for pages per day: 4,048
Failed requests: 764
Redirected requests: 3
Distinct files requested: 527
Distinct hosts served: 406
Corrupt logfile lines: 120
Data transferred: 553.88 megabytes
Average data transferred per day: 554.27 megabytes
(Go To: Top: General Summary: Daily Summary: Hourly Summary: Domain Report: Organization Report: Operating System Report: Status Code Report: File Size Report: File Type Report: Directory Report: Request Report)
This report lists the total activity for each day of the week, summed over all the weeks in the report.
Each unit ( ) represents 100 requests
for pages or part thereof.
) represents 100 requests
for pages or part thereof.
day: #reqs: #pages: ---: -----: ------: Sun: 4495: 4043:
(Go To: Top: General Summary: Daily Summary: Hourly Summary: Domain Report: Organization Report: Operating System Report: Status Code Report: File Size Report: File Type Report: Directory Report: Request Report)
This report lists the total activity for each hour of the day, summed over all the days in the report.
Each unit () represents 8 requests
for pages or part thereof.
hour: #reqs: #pages: ----: -----: ------: 0: 355: 337:3: 209: 189:
4: 214: 197:
(Go To: Top: General Summary: Daily Summary: Hourly Summary: Domain Report: Organization Report: Operating System Report: Status Code Report: File Size Report: File Type Report: Directory Report: Request Report)
This report lists the countries of the computers which requested files.
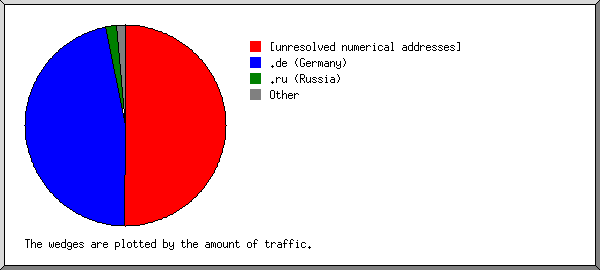
Listing domains, sorted by the amount of traffic.
#reqs: %bytes: domain
-----: ------: ------
  480: 35.39%: .ru (Russia)
  500: 33.91%: .com (Commercial)
 3081: 29.16%: [unresolved numerical addresses]
  117:  0.98%: [unknown domain]
  220:  0.46%: .net (Networks)
    2:  0.03%: .es (Spain)
   89:  0.02%: .de (Germany)
    1:  0.02%: .hr (Croatia)
    1:  0.02%: .pt (Portugal)
    2:  0.01%: .uz (Uzbekistan)
    1:  0.01%: .ve (Venezuela)
    1:       : .pk (Pakistan)
    1:       : .br (Brazil)
    1:       : .nl (Netherlands)
    1:       : .vn (Vietnam)
    1:       : .cz (Czech Republic)
(Go To: Top: General Summary: Daily Summary: Hourly Summary: Domain Report: Organization Report: Operating System Report: Status Code Report: File Size Report: File Type Report: Directory Report: Request Report)
This report lists the organizations of the computers which requested files.
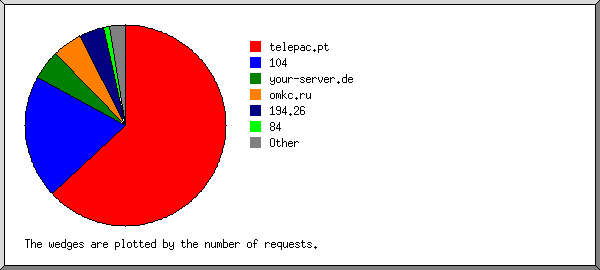
Listing the top 20 organizations by the number of requests, sorted by the number of requests.
#reqs: %bytes: organization
-----: ------: ------------
 2024:  0.61%: 77
  781: 26.62%: 5
  459: 34.61%: ertelecom.ru
  265: 32.84%: hosted-by-vdsina.com
  210:  0.44%: ovh.net
  117:  0.98%: [unknown domain]
   67:  0.31%: googlebot.com
   60:  0.18%: amazonaws.com
   56:  0.02%: seokicks.de
   40:  0.06%: 43
   35:  0.20%: semrush.com
   33:       : your-server.de
   18:  0.24%: 216.244
   16:  0.06%: 20
   12:  0.02%: seranking.com
   12:  0.06%: petalsearch.com
   11:  0.38%: 104
   11:  0.04%: 82
   10:  0.16%: datapacket.com
    7:  0.01%: 67.205
  255:  2.16%: [not listed: 116 organizations]
(Go To: Top: General Summary: Daily Summary: Hourly Summary: Domain Report: Organization Report: Operating System Report: Status Code Report: File Size Report: File Type Report: Directory Report: Request Report)
This report lists the operating systems used by visitors.
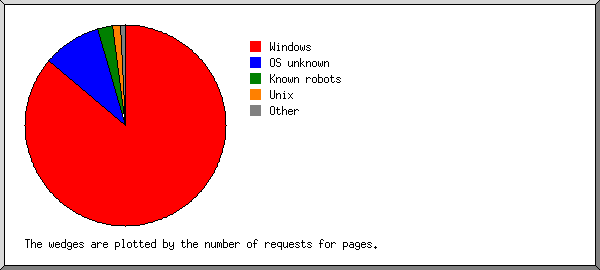
Listing operating systems, sorted by the number of requests for pages.
 #: #reqs: #pages: OS
--: -----: ------: --
 1:  3885:   3592: Windows
  :  3871:   3579:   Windows NT
  :    14:     13:   Unknown Windows
 2:   234:    179: OS unknown
 3:   129:    122: Macintosh
 4:    83:     81: Unix
  :    82:     80:   Linux
  :     1:      1:   Other Unix
 5:   162:     73: Known robots
(Go To: Top: General Summary: Daily Summary: Hourly Summary: Domain Report: Organization Report: Operating System Report: Status Code Report: File Size Report: File Type Report: Directory Report: Request Report)
This report lists the HTTP status codes of all requests.
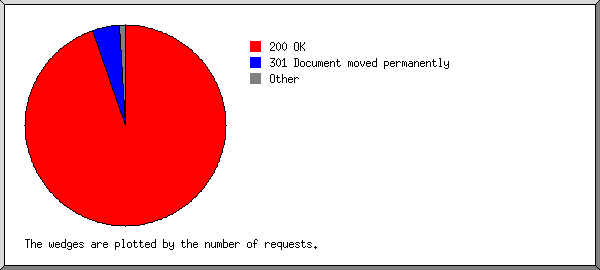
Listing status codes, sorted numerically.
#reqs: status code
-----: -----------
 4484: 200 OK
   11: 206 Partial content
    3: 301 Document moved permanently
    4: 304 Not modified since last retrieval
  764: 404 Document not found
(Go To: Top: General Summary: Daily Summary: Hourly Summary: Domain Report: Organization Report: Operating System Report: Status Code Report: File Size Report: File Type Report: Directory Report: Request Report)
This report lists the sizes of files.
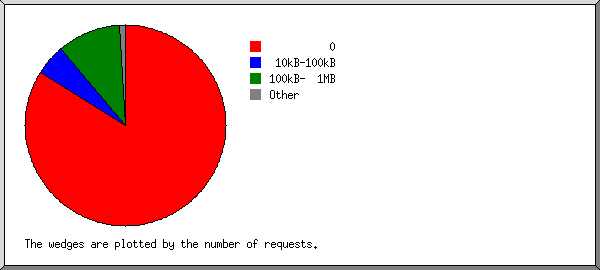
       size: #reqs: %bytes:
-----------: -----: ------:
          0:     5:       :
   1B-  10B:     0:       :
  11B- 100B:     2:       :
 101B-  1kB:   212:  0.02%:
  1kB- 10kB:  2241:  0.76%:
 10kB-100kB:   622:  3.72%:
100kB-  1MB:  1417: 95.49%:
(Go To: Top: General Summary: Daily Summary: Hourly Summary: Domain Report: Organization Report: Operating System Report: Status Code Report: File Size Report: File Type Report: Directory Report: Request Report)
This report lists the extensions of files.
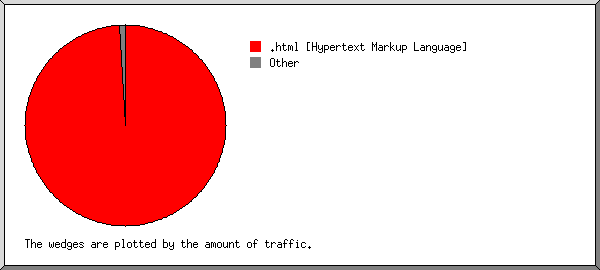
Listing extensions with at least 0.1% of the traffic, sorted by the amount of traffic.
#reqs: %bytes: extension
-----: ------: ---------
 1888: 97.55%: .html [Hypertext Markup Language]
  364:  1.51%: .jpg  [JPEG graphics]
 2152:  0.71%: [directories]
    7:  0.11%: .db
   88:  0.12%: [not listed: 8 extensions]
(Go To: Top: General Summary: Daily Summary: Hourly Summary: Domain Report: Organization Report: Operating System Report: Status Code Report: File Size Report: File Type Report: Directory Report: Request Report)
This report lists the directories from which files were requested. (The figures for each directory include all of its subdirectories.)
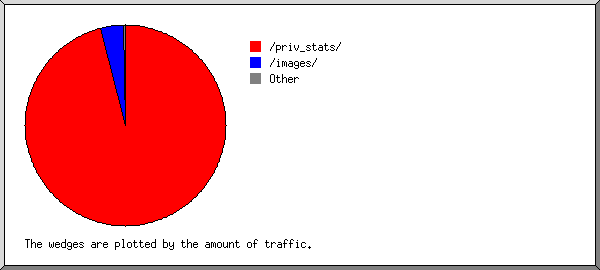
Listing directories with at least 0.01% of the traffic, sorted by the amount of traffic.
#reqs: %bytes: directory
-----: ------: ---------
 3841: 98.16%: /priv_stats/
  409:  1.67%: /images/
   23:  0.13%: http://
  218:  0.04%: [root directory]
    8:       : [not listed: 3 directories]
(Go To: Top: General Summary: Daily Summary: Hourly Summary: Domain Report: Organization Report: Operating System Report: Status Code Report: File Size Report: File Type Report: Directory Report: Request Report)
This report lists the files on the site.
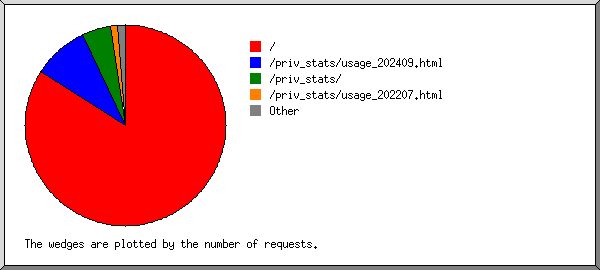
Listing files with at least 20 requests, sorted by the number of requests.
#reqs: %bytes:          last time: file
-----: ------: ------------------: ----
 2030:  0.62%: Aug/ 2/26 11:59 PM: /priv_stats/
  784: 26.96%: Aug/ 3/26 12:01 AM: /priv_stats/usage_202512.html
  578: 35.09%: Aug/ 2/26 11:29 PM: /priv_stats/usage_202608.html
  258: 32.70%: Aug/ 2/26  1:55 AM: /priv_stats/usage_202607.html
   96:  0.01%: Aug/ 2/26 11:54 PM: /
   40:  0.82%: Aug/ 2/26 11:29 PM: /priv_stats/usage_202203.html
   30:  0.20%: Aug/ 2/26 11:14 PM: /priv_stats/usage_202206.html
  683:  3.60%: Aug/ 2/26 11:59 PM: [not listed: 514 files]
(Go To: Top: General Summary: Daily Summary: Hourly Summary: Domain Report: Organization Report: Operating System Report: Status Code Report: File Size Report: File Type Report: Directory Report: Request Report)


